Notice: Uninitialized string offset: 0 in /www/wwwroot/xmxmcom.com/wp-includes/class-walker-comment.php on line 1

Notice: Uninitialized string offset: 0 in /www/wwwroot/xmxmcom.com/wp-includes/class-walker-comment.php on line 1

Notice: Uninitialized string offset: 0 in /www/wwwroot/xmxmcom.com/wp-includes/html-api/class-wp-html-processor.php on line 1

Notice: Uninitialized string offset: 0 in /www/wwwroot/xmxmcom.com/wp-includes/html-api/class-wp-html-processor.php on line 1

Notice: Uninitialized string offset: 0 in /www/wwwroot/xmxmcom.com/wp-includes/rest-api/endpoints/class-wp-rest-menus-controller.php on line 1

Notice: Uninitialized string offset: 0 in /www/wwwroot/xmxmcom.com/wp-includes/rest-api/endpoints/class-wp-rest-menus-controller.php on line 1

Notice: Uninitialized string offset: 0 in /www/wwwroot/xmxmcom.com/wp-includes/rest-api/endpoints/class-wp-rest-themes-controller.php on line 1

Notice: Uninitialized string offset: 0 in /www/wwwroot/xmxmcom.com/wp-includes/rest-api/endpoints/class-wp-rest-themes-controller.php on line 1
Technical Analysis – GBPJPY eases after hitting new 16-year high – XMDailyFX

Technical Analysis – GBPJPY eases after hitting new 16-year high

  • GBPJPY remains in strong upside tendency in long-term

  • RSI flirts with uptrend line above 70

  • Stochastic looks overstretched

  • Post Preview

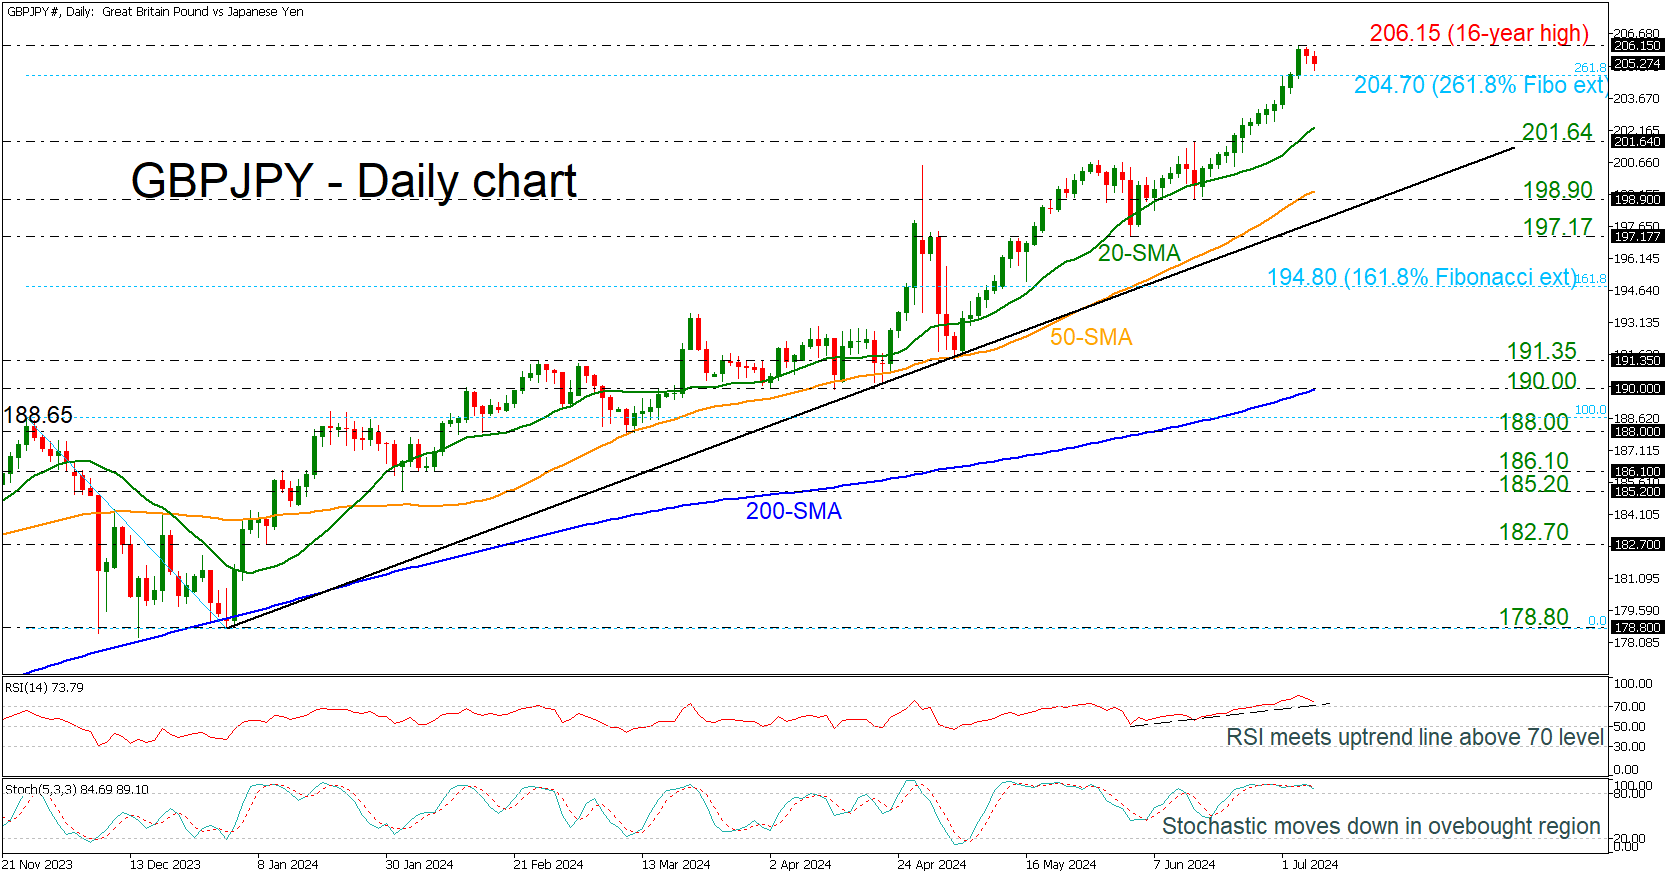
GBPJPY is declining somewhat after rallying to a fresh 16-year high of 206.15 earlier in the week. The pair posted 13 straight days of gains before falling near the 261.8% Fibonacci extension level of the down leg from 188.65 to 178.80 at 204.70.


The technical oscillators indicate an overstretched market, as the RSI is heading south, meeting the uptrend line that has been holding since the beginning of June, above the 70 level. Also, the stochastic oscillator is pointing down after the bearish crossover within the %K and %D lines above the 80 level.


If there are more declines and a dive below the immediate Fibonacci level, the market could visit the 20-day simple moving average (SMA) at 202.30, ahead of the 201.64 support level. Even lower, the bearish correction may continue until the 50-day SMA, near the 198.90 support, before testing the long-term ascending trend line at 198.50.


In the positive scenario, a successful climb above the latest multi-year peak could meet the next round numbers, such as 207.00 and 208.00, until the high in July 2008 at 215.90.


All in all, GBPJPY has been in a strong upward trend since the start of the year, and only a decisive fall below the 200-day SMA near the 190.00 psychological mark could change the current outlook.

Related Posts

Weekly Technical Outlook – USDJPY, GBPUSD, NZDUSD

USDJPY faces minor injuries after higher US jobless rate; Powell’s testimony next on the agenda GBPUSD surprasses key obstacle as UK gets new government; monthly GDP data on the agenda NZDUSD waits…

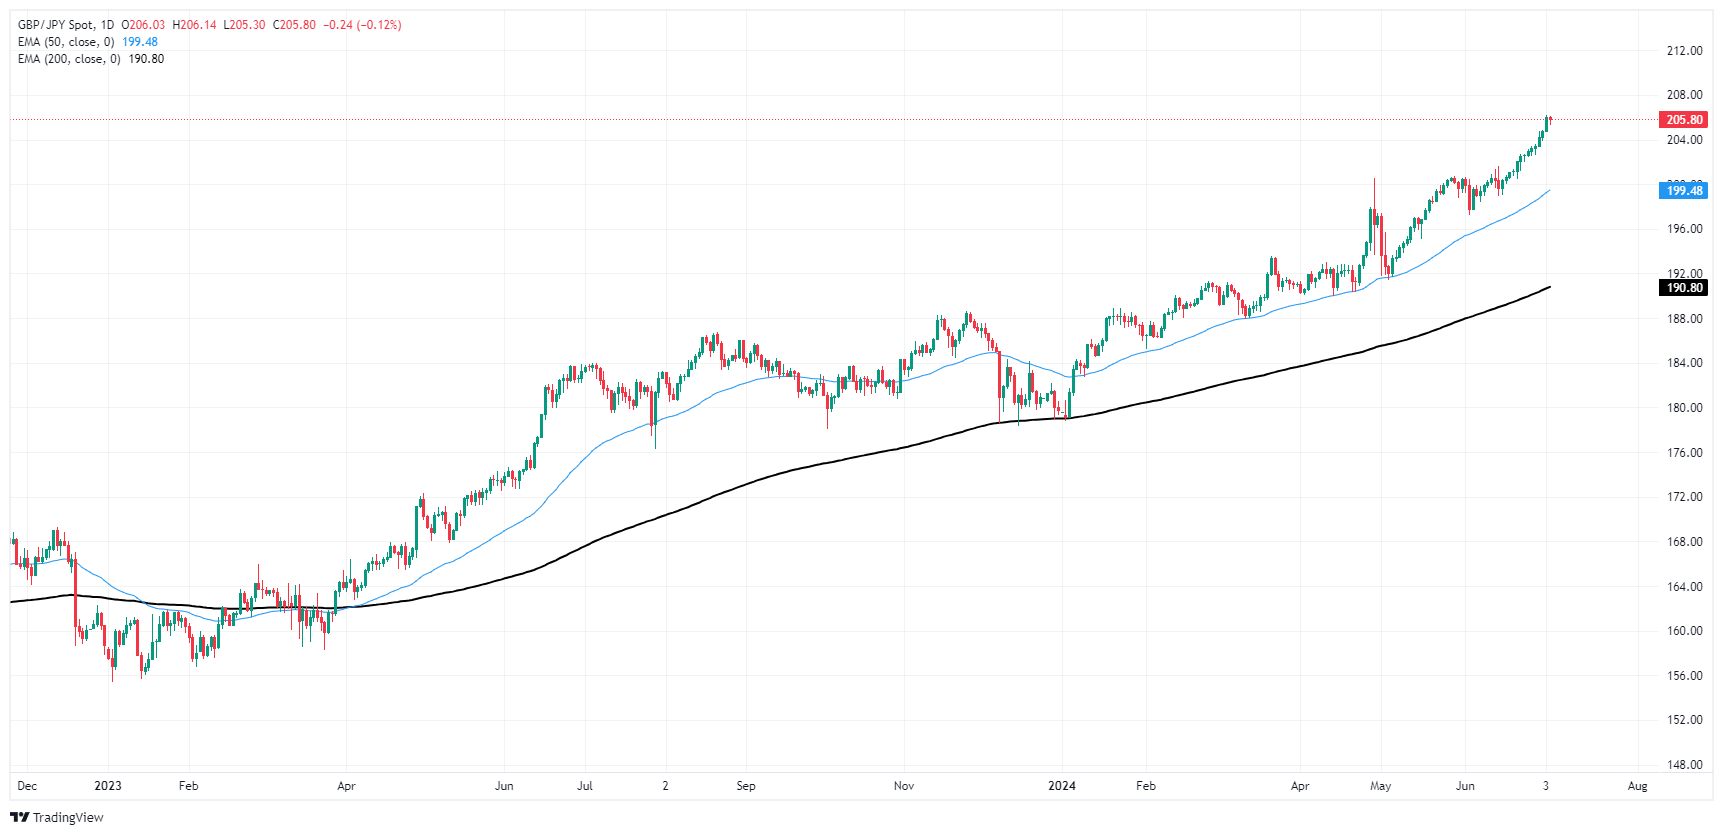
GBP/JPY takes a breather at the top end of 13-day win streak

GBP/JPY is middling on Thursday, pausing after a 13-day climb. Data for both currencies remains limited, but UK elections could spark volatility. Japanese Yen likely to continue deflating as BOJ…

Leave a Reply

Your email address will not be published. Required fields are marked *

Forex Education

5 TRADING STRATEGIES EVERY TRADER SHOULD KNOW

  • By admin
  • July 4, 2024
  • 121 views
5 TRADING STRATEGIES EVERY TRADER SHOULD KNOW

7 WAYS TO REDUCE RISK IN ONLINE TRADING

  • By admin
  • March 30, 2022
  • 429 views
7 WAYS TO REDUCE RISK IN ONLINE TRADING

8 ONLINE TRADING INDICATORS TO USE IN YOUR STRATEGY

  • By admin
  • March 30, 2022
  • 455 views
8 ONLINE TRADING INDICATORS TO USE IN YOUR STRATEGY

8 KEY ONLINE TRADING TERMS EVERY BEGINNER SHOULD KNOW

  • By admin
  • March 30, 2022
  • 425 views
8 KEY ONLINE TRADING TERMS EVERY BEGINNER SHOULD KNOW

7 WAYS TO BUILD AN ONLINE TRADING PLAN THAT WORKS FOR YOU

  • By admin
  • March 30, 2022
  • 414 views
7 WAYS TO BUILD AN ONLINE TRADING PLAN THAT WORKS FOR YOU