-
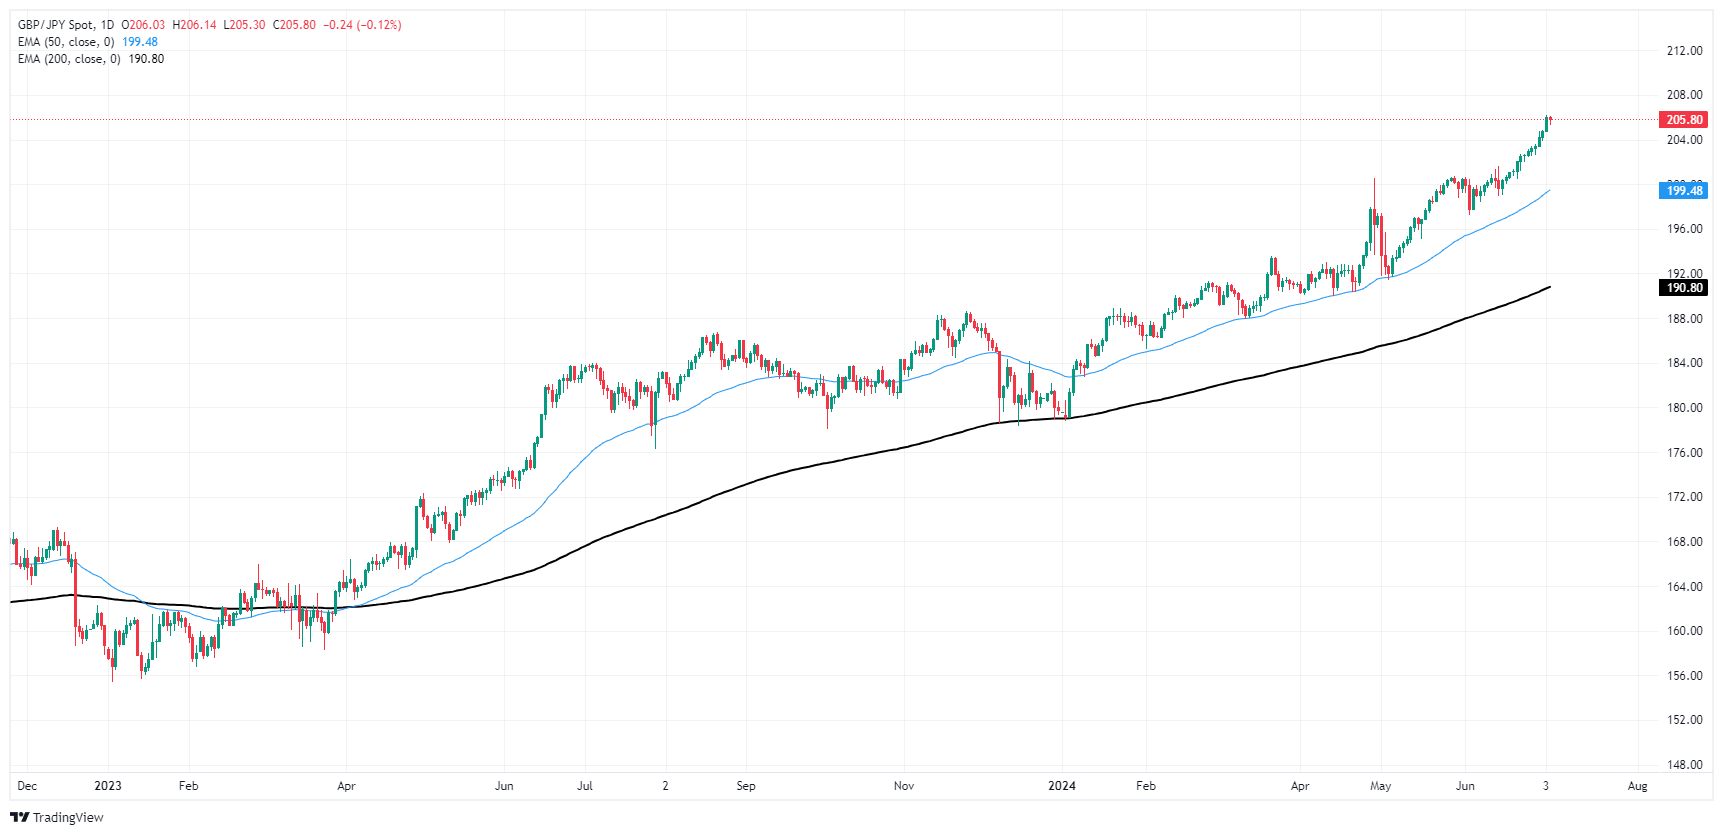
GBPJPY remains in strong upside tendency in long-term
-
RSI flirts with uptrend line above 70
-
Stochastic looks overstretched

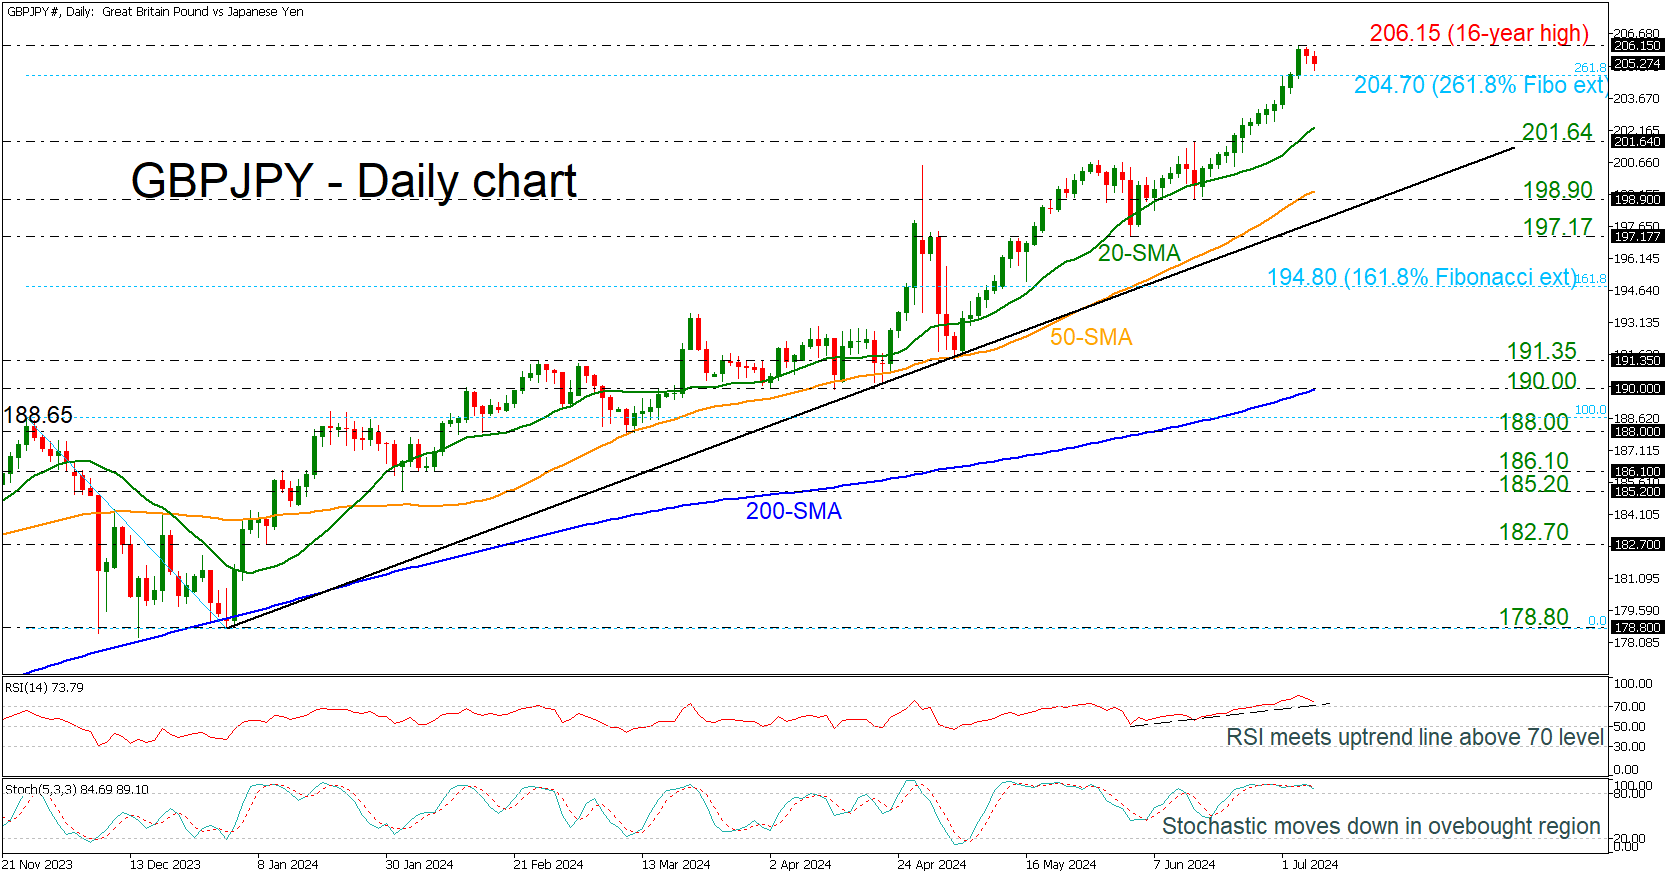
GBPJPY is declining somewhat after rallying to a fresh 16-year high of 206.15 earlier in the week. The pair posted 13 straight days of gains before falling near the 261.8% Fibonacci extension level of the down leg from 188.65 to 178.80 at 204.70.
The technical oscillators indicate an overstretched market, as the RSI is heading south, meeting the uptrend line that has been holding since the beginning of June, above the 70 level. Also, the stochastic oscillator is pointing down after the bearish crossover within the %K and %D lines above the 80 level.
If there are more declines and a dive below the immediate Fibonacci level, the market could visit the 20-day simple moving average (SMA) at 202.30, ahead of the 201.64 support level. Even lower, the bearish correction may continue until the 50-day SMA, near the 198.90 support, before testing the long-term ascending trend line at 198.50.
In the positive scenario, a successful climb above the latest multi-year peak could meet the next round numbers, such as 207.00 and 208.00, until the high in July 2008 at 215.90.
All in all, GBPJPY has been in a strong upward trend since the start of the year, and only a decisive fall below the 200-day SMA near the 190.00 psychological mark could change the current outlook.


